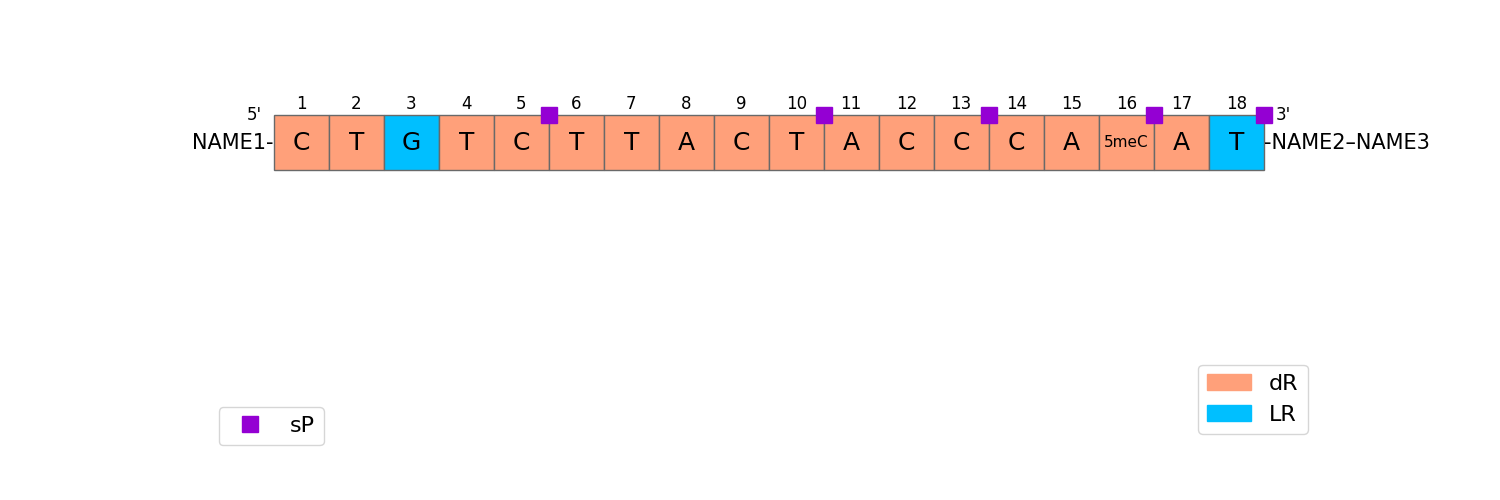
Draw a cartoon
With HELMshaker, you can visualize an oligonucleotide and customize the cartoon. For ASOs, a single strand is drawn. For siRNAs, the cartoon is based on the hydrogen pairings in the molecule. These pairings need to be available for siRNA cartoon visualizations.
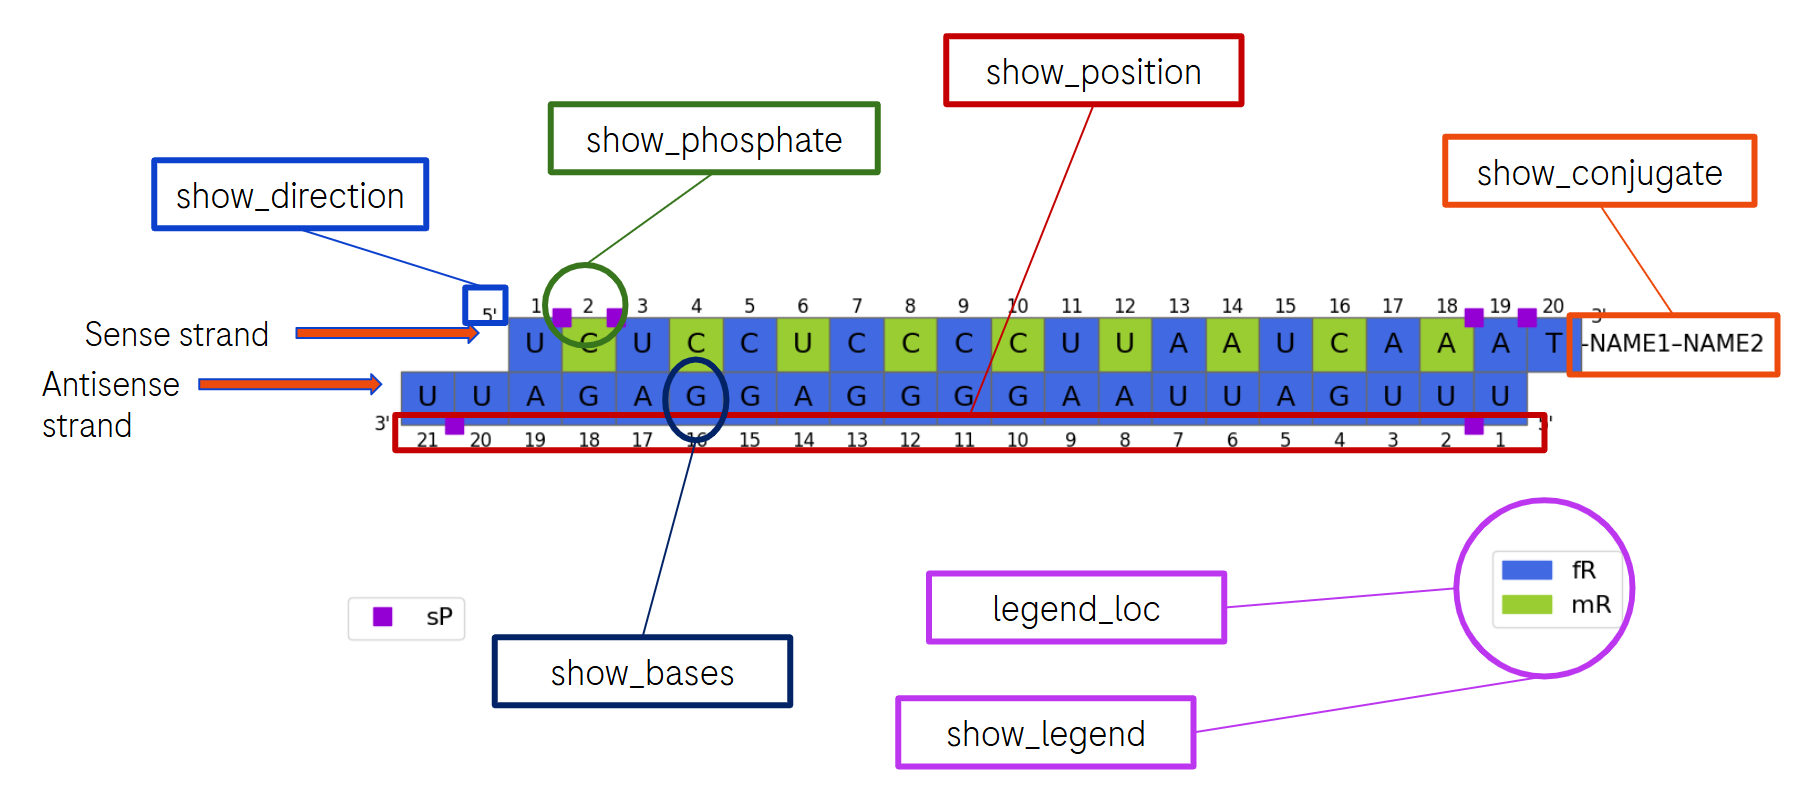
Customization Options
title: Title of the plotstart_polymer: Optional, the strand which is drawn first from left to right (will be on top)show_position: Shows the numbering of nucleotide positionsshow_direction: Annotates 5' and 3' endsshow_legend: Shows the color legendshow_base: Annotates basescolor_map: Custom color map (if desired)show_phosphate: Shows specific phosphate linkersshow_conjugate: Annotates the conjugate namesfont_size: Font size, scaling up all fonts in the cartoon
Examples
The examples below all draw the same siRNA. Load it once, against a library you
have already loaded. HELMshaker ships no monomers, so see
Monomer Libraries for how to get one.
from helmshaker import Molecule, MonomerLibrary

library = MonomerLibrary()
library.load_from_file("monomers.json")  # your dictionary, or one pulled from TMR

sirna = "CHEM1{[Ahx]}|CHEM2{[PEG4]}|RNA1{[fl2r](U)[sp].[m](C)[sp].[fl2r](U)p.[m](C)p.[fl2r](G)p.[m](U)p.[fl2r](G)p.[m](G)p.[fl2r](C)p.[m](C)p.[fl2r](U)p.[m](U)p.[fl2r](A)p.[m](A)p.[fl2r](U)p.[m](G)p.[fl2r](A)p.[m](A)[sp].[fl2r](A)[sp].[fl2r](T)}|RNA2{[fl2r](U)[sp].[fl2r](U)p.[fl2r](U)p.[fl2r](C)p.[fl2r](A)p.[fl2r](U)p.[fl2r](U)p.[fl2r](A)p.[fl2r](A)p.[fl2r](G)p.[fl2r](G)p.[fl2r](C)p.[fl2r](C)p.[fl2r](A)p.[fl2r](C)p.[fl2r](G)p.[fl2r](A)p.[fl2r](G)p.[fl2r](A)p.[fl2r](U)[sp].[fl2r](U)}$RNA1,CHEM1,61:R2-1:R1|CHEM1,CHEM2,1:R2-1:R1|RNA1,RNA2,2:pair-56:pair|RNA1,RNA2,56:pair-2:pair$$$V2.0"

molecule = Molecule.from_helm(sirna, monomer_library=library)
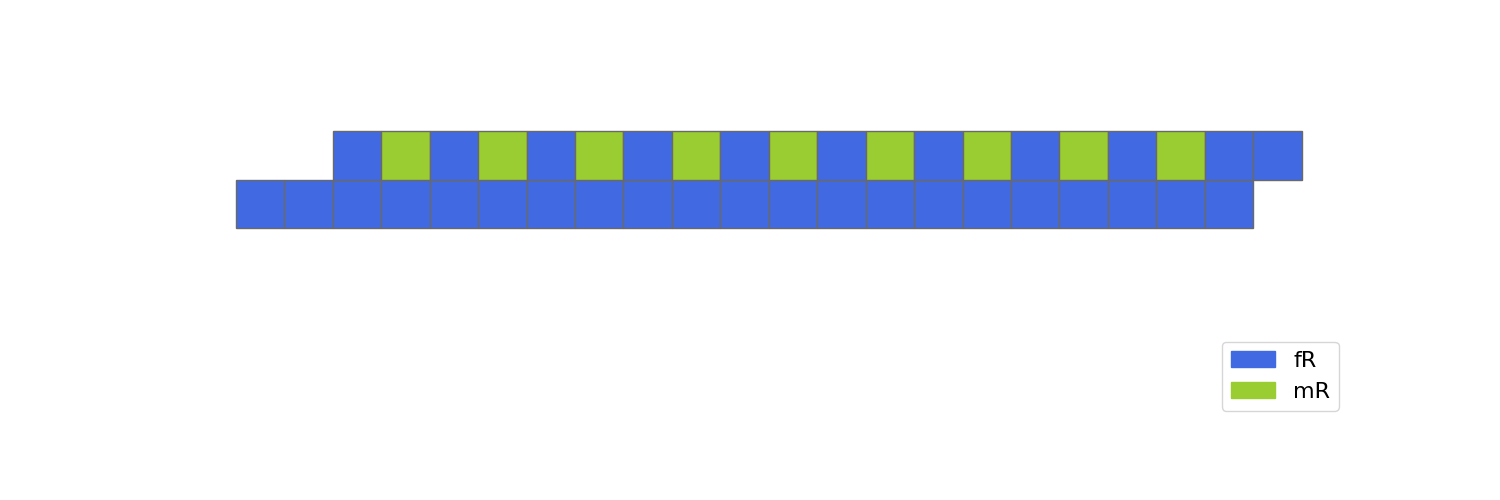
A simple cartoon of a naked siRNA:
fig, ax = molecule.visualize_cartoon(
    show_position=False,
    show_conjugate=False,
    show_direction=False
)
fig.savefig('sample.png')
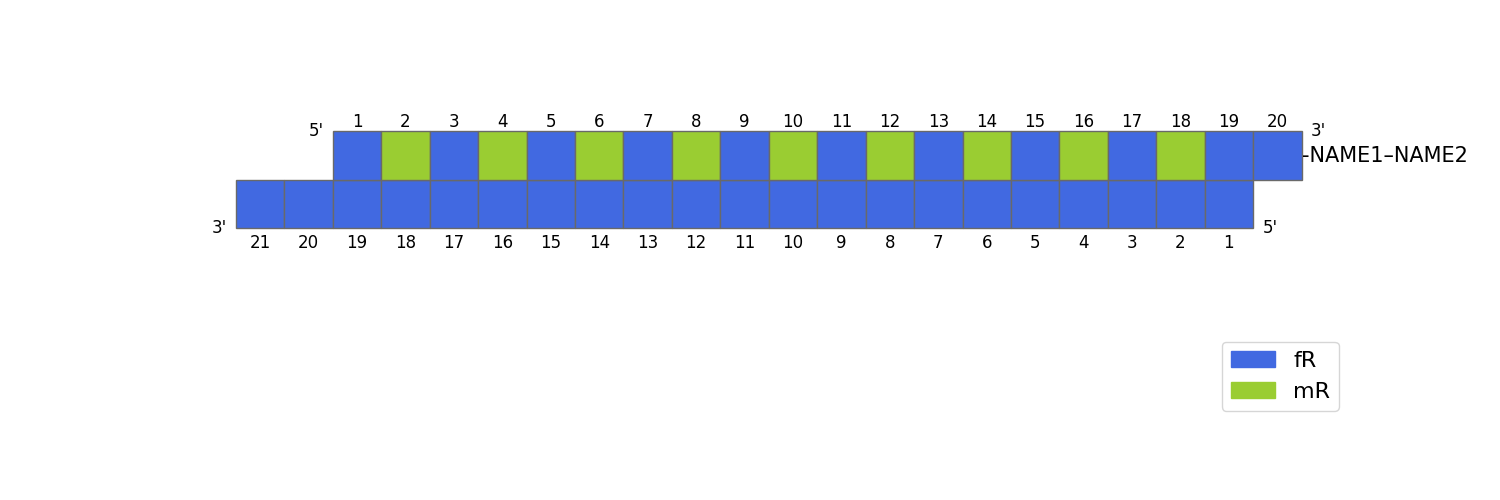
Add positions and conjugates:
fig, ax = molecule.visualize_cartoon(
    show_position=True,
    show_conjugate=True,
    show_direction=True
)
fig.savefig('sample.png')
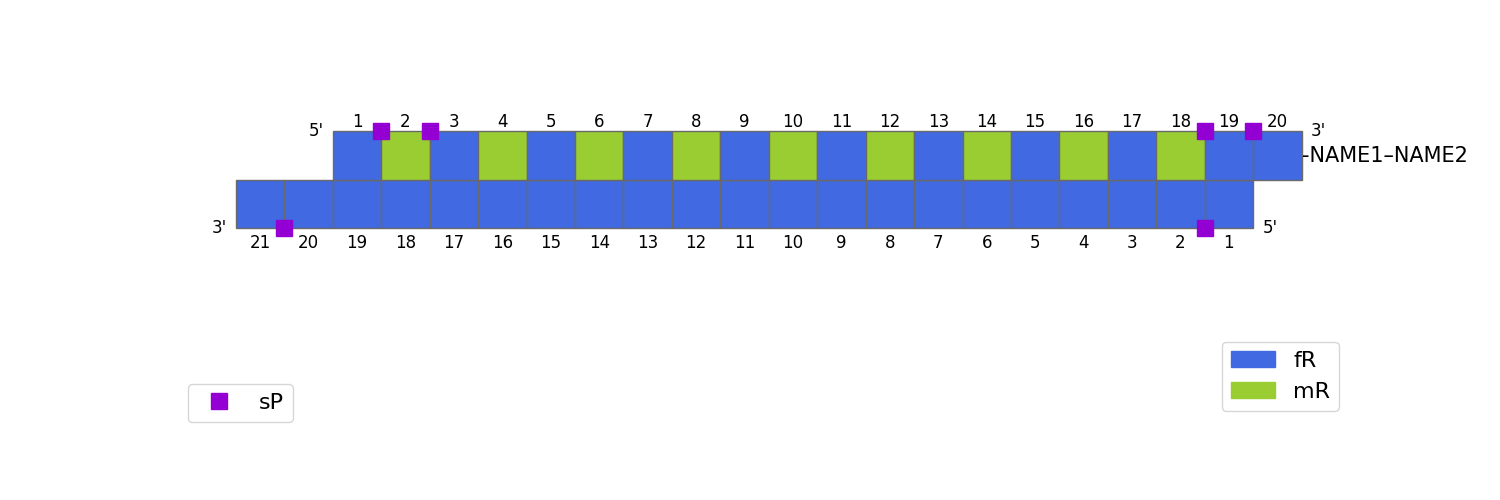
Add specific phosphate linkers:
fig, ax = molecule.visualize_cartoon(
    show_base=False,
    show_direction=True,
    show_position=True,
    show_phosphate=True,
    show_legend=True,
    show_conjugate=True
)
fig.savefig('sample.png')
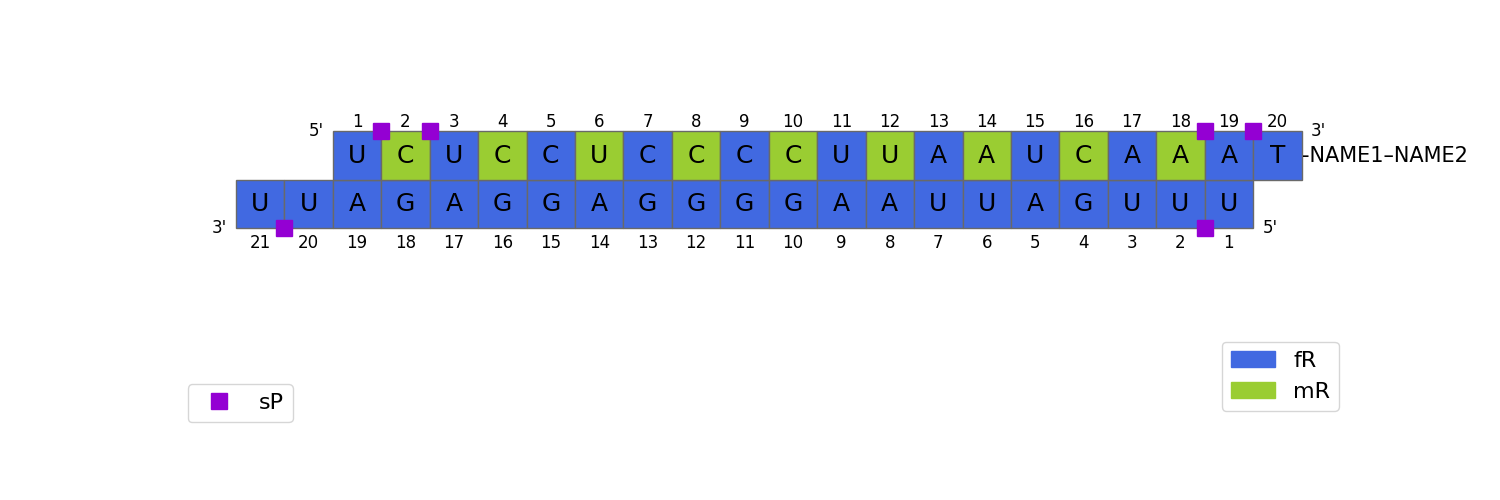
Add bases:
fig, ax = molecule.visualize_cartoon(
    show_position=True,
    show_base=True,
    show_conjugate=True,
    show_direction=True
)
fig.savefig('sample.png')
Full Example
from helmshaker import Molecule

sirna = "CHEM1{[Ahx]}|CHEM2{[PEG4]}|RNA1{[fl2r](U)[sp].[m](C)[sp].[fl2r](U)p.[m](C)p.[fl2r](G)p.[m](U)p.[fl2r](G)p.[m](G)p.[fl2r](C)p.[m](C)p.[fl2r](U)p.[m](U)p.[fl2r](A)p.[m](A)p.[fl2r](U)p.[m](G)p.[fl2r](A)p.[m](A)[sp].[fl2r](A)[sp].[fl2r](T)}|RNA2{[fl2r](U)[sp].[fl2r](U)p.[fl2r](U)p.[fl2r](C)p.[fl2r](A)p.[fl2r](U)p.[fl2r](U)p.[fl2r](A)p.[fl2r](A)p.[fl2r](G)p.[fl2r](G)p.[fl2r](C)p.[fl2r](C)p.[fl2r](A)p.[fl2r](C)p.[fl2r](G)p.[fl2r](A)p.[fl2r](G)p.[fl2r](A)p.[fl2r](U)[sp].[fl2r](U)}$RNA1,CHEM1,61:R2-1:R1|CHEM1,CHEM2,1:R2-1:R1|RNA1,RNA2,2:pair-56:pair|RNA1,RNA2,56:pair-2:pair$$$V2.0"

molecule = Molecule.from_helm(sirna, monomer_library=library)

fig, ax = molecule.visualize_cartoon(
    title="siRNA Visualization",
    start_polymer="RNA2",  # polymer to start drawing from, this will be on top
    show_base=True,        # annotates bases
    show_direction=True,   # annotates 5' and 3' ends
    show_position=True,    # annotates each nucleotide position
    show_phosphate=True,   # color the phosphate linkers
    show_conjugate=True,
    show_legend=True,      # shows color legend
    font_size=12           # font size
)

fig.savefig("sample.png")
Working with the Figure and Axes
The visualize_cartoon() method returns a tuple of (Figure, Axes) for further customization:
fig, ax = molecule.visualize_cartoon(show_position=False)

# Further customize with matplotlib
ax.set_title("Custom Title", fontsize=16)
fig.tight_layout()
fig.savefig('sample.png', dpi=300)
ASO Cartoon
The ASO cartoon has the same customization options:
aso = "CHEM1{[Ahx]}|CHEM2{[PEG4]}|CHEM3{[OVal]}|RNA1{p.[d](C)p.[d](A)p.[lna](G)[sp].[lna](A)[sp].[lna](G)[sp].[d](T)[sp].[d](T)[sp].[d](A)[sp].[d](C)[sp].[d](T)[sp].[d](T)[sp].[d](G)[sp].[d](C)[sp].[d](C)[sp].[d](A)[sp].[lna](A)[sp].[lna]([m5C])[sp].[lna](T)[sp]}$CHEM1,RNA1,1:R2-1:R1|RNA1,CHEM2,55:R2-1:R1|CHEM2,CHEM3,1:R2-1:R1$$$V2.0"

molecule = Molecule.from_helm(aso, monomer_library=library)

fig, ax = molecule.visualize_cartoon(
    show_phosphate=True,
    show_base=True
)
fig.savefig("aso.png")